function [matLEA,neg_log_corr_sp] = knnlea(matCoordinates,matFeature,K,matContinuousVar)
if nargin<3
K = 200;
end
if nargin==0
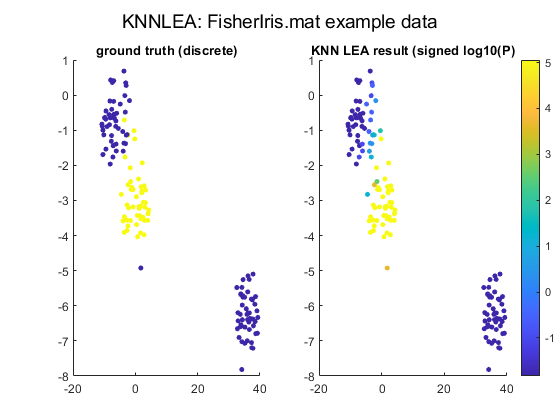
fprintf('%s: Running in DEMO mode\n',mfilename)
objTmpData = load('fisheriris.mat');
matCoordinates = objTmpData.meas;
matFeature = strcmpi(objTmpData.species,'versicolor');
K = 10;
end
matLEA = NaN(size(matFeature));
if nargout>1
neg_log_corr_sp = NaN(size(matFeature));
end
idx = knnsearch(matCoordinates,matCoordinates,'K',K);
if isequal(matFeature(~isnan(matFeature)), logical(matFeature(~isnan(matFeature))))
fprintf('%s: Calculating local hypergeometric LEA scores\n',mfilename)
for i = 1:size(matFeature,2)
matF = matFeature(:,i);
matKNNFeature = matF(idx);
matLEA_P_U = hygecdf(nansum(matKNNFeature,2),sum(~isnan(matF)),nansum(matF(:)),sum(~isnan(matKNNFeature),2),'upper');
matLEA_P_D = hygecdf(nansum(matKNNFeature,2),sum(~isnan(matF)),nansum(matF(:)),sum(~isnan(matKNNFeature),2));
matLEA_P_U = fixinfs(-log10(matLEA_P_U));
matLEA_P_D = fixinfs(-log10(matLEA_P_D));
matLEA(:,i) = matLEA_P_U;
matLEA(matLEA_P_U<matLEA_P_D,i) = -matLEA_P_D(matLEA_P_U<matLEA_P_D);
matLEA(isnan(matKNNFeature(:,1)),i) = NaN;
end
else
warning('bs:Bla','%s: Not calculating the hypergeometric LEA scores as the second input (matFeature) is not discrete',mfilename)
end
if nargin==4
neg_log_corr_sp = nan(size(matFeature,1),size(matContinuousVar,2));
fprintf('%s: Calculating local spearman correlations\n',mfilename)
gIND = vec2ind(matFeature')';
gIND = gIND(idx);
matCountPerClass = sum(matFeature);
[x] = cell2mat(cellfun(@(c) countUnique(c,1:size(matFeature,2)), num2cell(gIND, 2),'uni',0));
x_rel = x./repmat(matCountPerClass,[size(matFeature,1),1]);
for i = 1:size(matContinuousVar,2)
if all(~isnan(x_rel(:))) && all(~isnan(matContinuousVar(:,i)))
[corr_sp,pCorr] = corr(x_rel',matContinuousVar(:,i),'type','spearman');
else
[corr_sp,pCorr] = corr(x_rel',matContinuousVar(:,i),'rows','pairwise','type','spearman');
end
neg_log_corr_sp(:,i) = -log10(pCorr) .* sign(corr_sp);
end
end
if nargin==0
fprintf('%s: Plotting DEMO results\n',mfilename)
matTSNE = tsne(matCoordinates);
figure;
subplot(1,2,1)
scatter(matTSNE(:,1),matTSNE(:,2),15,matFeature,'filled');
title('ground truth (discrete)')
subplot(1,2,2)
scatter(matTSNE(:,1),matTSNE(:,2),15,matLEA,'filled');
title('KNN LEA result (signed log10(P)')
colorbar()
suptitle('KNNLEA: FisherIris.mat example data')
end
end
function [a_counts,C]=countUnique(vec,matchgrouping)
if nargin ==1
[C,~,ic] = unique(vec);
a_counts = accumarray(ic,1);
else
[Ctemp,~,ic] = unique(vec);
temp = accumarray(ic,1);
C = matchgrouping;
a_counts = zeros(size(matchgrouping));
a_counts(Ctemp)=temp;
end
end
function x = fixinfs(x,infVal)
if all(isinf(x)|isnan(x))
warning('bs:BLA','%s: can''t fix infs or nans if all values are inf or nan',mfilename)
return
end
if nargin<2
x(isinf(x) & sign(x)>0) = max(x(~isinf(x)));
x(isinf(x) & sign(x)<0) = min(x(~isinf(x)));
else
x(isinf(x) & sign(x)>0) = infVal;
x(isinf(x) & sign(x)<0) = -infVal;
end
end
knnlea: Running in DEMO mode
knnlea: Calculating local hypergeometric LEA scores
knnlea: Plotting DEMO results

ans =

   -1.8297
   -1.8297
   -1.8297
   -1.8297
   -1.8297
   -1.8297
   -1.8297
   -1.8297
   -1.8297
   -1.8297
   -1.8297
   -1.8297
   -1.8297
   -1.8297
   -1.8297
   -1.8297
   -1.8297
   -1.8297
   -1.8297
   -1.8297
   -1.8297
   -1.8297
   -1.8297
   -1.8297
   -1.8297
   -1.8297
   -1.8297
   -1.8297
   -1.8297
   -1.8297
   -1.8297
   -1.8297
   -1.8297
   -1.8297
   -1.8297
   -1.8297
   -1.8297
   -1.8297
   -1.8297
   -1.8297
   -1.8297
   -1.8297
   -1.8297
   -1.8297
   -1.8297
   -1.8297
   -1.8297
   -1.8297
   -1.8297
   -1.8297
    5.0564
    5.0564
    5.0564
    5.0564
    5.0564
    5.0564
    3.6517
    5.0564
    5.0564
    5.0564
    5.0564
    5.0564
    5.0564
    2.6029
    5.0564
    5.0564
    5.0564
    5.0564
    1.7877
    5.0564
    1.7877
    5.0564
    1.1575
    5.0564
    5.0564
    5.0564
    5.0564
    1.1575
    5.0564
    5.0564
    5.0564
    5.0564
    5.0564
   -0.5361
    5.0564
    5.0564
    5.0564
    5.0564
    5.0564
    5.0564
    5.0564
    5.0564
    5.0564
    5.0564
    5.0564
    5.0564
    5.0564
    5.0564
    5.0564
    5.0564
   -1.8297
   -1.0172
   -1.8297
   -1.8297
   -1.8297
   -1.8297
    3.6517
   -1.8297
   -1.8297
   -1.8297
   -1.0172
   -1.8297
   -1.8297
   -1.0172
   -1.8297
   -1.8297
   -1.8297
   -1.8297
   -1.8297
    0.3559
   -1.8297
   -0.5361
   -1.8297
    0.3559
   -1.8297
   -1.8297
    0.3559
    0.6862
   -1.8297
   -1.8297
   -1.8297
   -1.8297
   -1.8297
    0.6862
   -0.5361
   -1.8297
   -1.8297
   -1.8297
    1.1575
   -1.8297
   -1.8297
   -1.0172
   -1.0172
   -1.8297
   -1.8297
   -1.8297
   -0.5361
   -1.0172
   -1.8297
   -0.5361